
General
Capturing the Split Seconds Between Victory and Defeat
Faced with the challenge of quickly recapping Olympic events, The Times creates its own animated versions of competitions. The internet loves them.
Times Insider explains who we are and what we do and delivers behind-the-scenes insights into how our journalism comes together.
It was the summer of 2016, and Derek Watkins, then a graphics editor at The New York Times, was staring down a challenge.
How could the newspaper provide coverage of Olympic events in record time for readers?
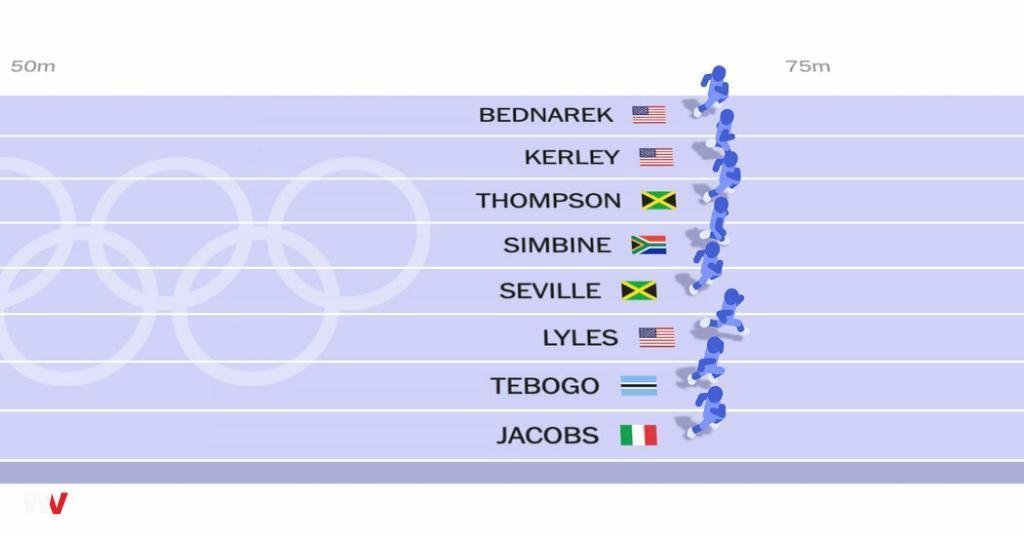
Mr. Watkins and other graphics editors decided upon what would eventually become a winning solution: a miniature version of the competitions, generated in a matter of minutes. Since the 2016 Games, members of the Digital News Design, Graphics, and Research and Development teams have created tiny, animated visualizations of Olympic events in swimming, running, skiing and figure skating.
“They looked like 2-D sprites,” Eden Weingart, an art director on the Digital News Design team, said of the earliest versions of the simulations. In each Olympics since, she and her team have built upon that initial idea.
This year’s track and field and swimming visuals have been a hit on TikTok and Instagram. Tiny swimming figures, now in 3-D, change strokes between laps in the medley events and race to video-game-like sound effects. On a track, animated runners break out of starting blocks and pump their arms, and viewers can see exactly when in the race they pull ahead or fall behind. Take Noah Lyles, who won the 100-meter dash on Sunday by five-thousandths of a second: It was hard to see on TV, but in the Times visual the Lyles avatar helped demonstrate to readers how he out-leaned the competition at the finish line.
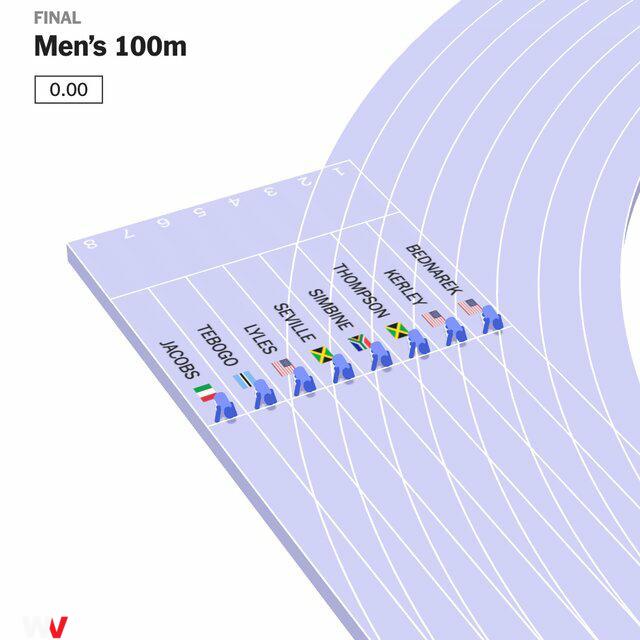
CreditCredit…Nick Bartzokas, Alice Fang, John Huang, and Eden Weingart/The New York Times
In a recent interview, Ms. Weingart shared the most challenging parts of creating the visualizations and what she and her team are planning to do next. These are edited excerpts.